Data Analysis
Develop data pipelines, Machine Learning, and Artificial Intelligence models, visualize and integrate data, and analyze them – together with Amazinum.
Develop data pipelines, Machine Learning, and Artificial Intelligence models, visualize and integrate data, and analyze them – together with Amazinum.
What is Data Analysis
$307.52 bn
The global big data analytics market is worth

91.9%
of organizations achieved measurable value from data and analytics investments in 2023

56%
of data leaders plan on increasing their budgets this year
up to 1.4 mil
new jobs in data processing and data analysis could be created between 2023 and 2027
and 2027

Data analysis is
a process of extracting information that helps companies make correct and informed decisions.
The Amazinum team has 7+ years of experience working with Data Analysis and knows exactly how to provide you with information in the form of images, tables, and graphs to protect your business from risks and provide relevant information.
Types of Data Analysis

Descriptive Analysis

Diagnostic Analysis

Predictive Analysis

Prescriptive Analytics
We are experienced in such expertise in Data Analysis:
Descriptive Analysis
Descriptive analytics looks at what happened in the past. Today, this method of data analysis is the most common for businesses. It answers the question “what happened” or “what is happening” and thus summarizes historical data
Summary statistics allow you to calculate average values and measures of variation such as range and standard deviation. It summarizes and describes basic data sets such as central tendency, variability, and distribution. Using this method, you can see an overview of the data, and based on it, determine patterns and relationships.
Why do you need Descriptive Statistics?
- It will give you the ability to effectively summarize and describe the main characteristics of a data set. Thanks to this, you can determine connections and regularities in them.
- It can help identify outliers, provide information on choosing appropriate statistical methods for further analysis, or summarize other characteristics.
- It will help you to understand the central tendency, variance, and distribution shape of a data set.
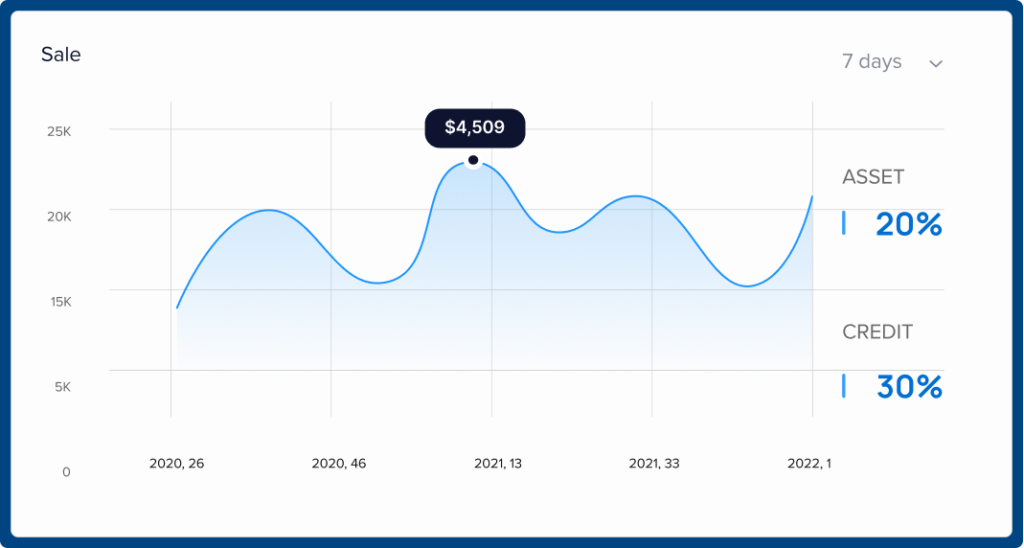
Data visualization allows you to represent information or data graphically. Through the use of visual elements such as charts, graphs, and maps, this technology helps you see and understand trends, patterns, deviations, or outliers in your data.
Why do you need Data Visualization?
- Data visualization technologies will help to streamline any large information
- Thanks to its accessible and understandable form, you can quickly make decisions and react to circumstances. Do not forget that timely actions will save your business from unnecessary costs and loss of authority
- You can quickly and efficiently identify differences in trends or indicators that are vital to the business. It is important to understand what causes costs and what brings profits
- Get information in real-time and improve the management of your business. Data visualization helps you improve operational efficiency and increase productivity
- Data visualization helps you explore business insights and achieve your goals. Analyze critical metrics and correlate data from visuals or graphs
- Save time and resources on customizing reports or predicting trends by leveraging data visualization and extracting data with custom-built reports
Data mining includes the search and analysis of a large part of raw data in order to identify patterns and extract useful information. It is based on data collection, further storage, and processing.
Intelligent data analysis will allow you to develop effective marketing strategies, increase sales, and reduce costs.
Why Do You Need Data Mining?
Amazinum Specialists will help you improve your business potential regardless of your industry domain with Data Mining Solution.
- Inclination to more efficient and smarter use of capital in order to increase profit
- Optimizing marketing campaigns based on demographic indicators of consumers and their behavior on the Internet
- Improving segmentation, cross-selling offers and customer loyalty programs, advertising offers, and thus – increasing investment in your business, or increasing profits
- Analysis of costs for raw materials and materials
- Analysis of the use of resources and materials
- Information about the company’s strengths and weaknesses
- By looking for patterns, trends, and correlations that connect the data, we help you identify outliers or correlations that shouldn’t exist.
- Detection of anomalies in data that resemble fraud.
- Eliminate fake accounts.
- Gathering data to understand the environment for students that supports their learning and success
- Monitoring and evaluation of student performance.
- Tracking of time spent and other indicators and online educational platforms.
- Collection of information about the client’s interaction with your service.
- Analysis of the weak and strong points of your service
Data aggregation is widely used in various industries. It helps to collect important information based on which decisions will be made.
Marketing
Data aggregation is becoming a must-have in digital marketing. It will help you understand user behavior, bounce rate, time spent, and a bunch of other metrics that influence your ad campaign and are responsible for its success.
Electronic commerce
With Amazinum Data Aggregation, you can analyze peak and off-peak traffic, visitor demographics, number of transactions, and whether customers made purchases based on recommendations. Collect data about competitors, their sales volume, and prices to make your services unique and customer-oriented.
Healthcare
Based on data aggregation, medical experts can suggest and develop more effective treatments and gather information about different cases and abnormalities.
Data aggregation can unlock the potential of your business or service. And Amazinum? Can help you with that.
Transform Your Data into Insights
Diagnostic Analysis
Diagnostic analysis works on the basis of information obtained from descriptive analytics while studying in detail the reasons for these results. It answers the question “Why did it happen?” This method of Data Analysis is used by analysts because it creates more connections between data and can identify possible behaviors.
Why do you need Diagnostic Analytics?
Diagnostic analytics is useful for any industry, as it can shed light on developing predictive models or creating successful business solutions.
Optimize medical documentation thanks to diagnostic analytics – calculate statistics and important information about patients, identify events or hospital resources, or even simulate the speed of disease diagnosis. By comparing this data to historical trends, you can easily build cause-and-effect relationships and identify anomalies.

Establish cause-and-effect relationships and determine the popularity of certain products. This will give you the opportunity to manage resources wisely, attract investments, and better understand your customers.

Diagnose hardware with diagnostic analytics, and calculate software updates or potential failures and their causes. This will help you avoid unnecessary costs or dangerous incidents in the workplace.

Diagnostic analytics have the potential to tell you about the working conditions of your employees, review pay scales, or take other steps to attract or retain employees.
Predictive Analysis
Predictive analytics is aimed at predicting future trends. She answers the question “What can happen in the future?”
Predictive analytics is very useful for business and can take strategy, sales, or customer communication to a new level. Business applications of predictive analytics include:
- Sales forecasting
- Risk assessment
- Customer segmentation
- Predictive analytics in customer success teams
Why do you need Predictive Analysis?
The Amazinum team will help you implement predictive analytics for your business. Our specialists know how to work with different domains and understand how Machine Learning and Data Analysis technologies will help you take your business or service to a new level.
Predictive analytics and Machine Learning are used to predict credit risk and detect fraud. It will help you maintain dynamic changes in the market in real-time. Amazinum will help you set up personal listening for customers and minimize risks. In addition, predictive analytics is widely used in credit scoring. With the help of data analysis technology, the bank receives a prediction about the performance of the granted loan based on the credit history of the applicant and the credit history of borrowers with similar characteristics.
Marketing departments often come into contact with business intelligence, because it helps them understand the performance of sales in past periods, understand whether the interaction with their customers is correct, and investigate their activity. For marketers, predictive data analysis is useful for forming and analyzing cross-selling strategies and other necessary information to understand whether the right business decisions have been made. Moving averages, ranges, and control points are based on historical data and are used to predict future prices.
Prognostic analytics can be used to treat and identify chronically ill patients, as well as track specific infections. In addition, predictive analytics helps analyze medical records and predict possible diseases based on them.
HR departments are perfecting various processes, such as forecasting future personnel needs, and requirements for a specific employee, or analyzing employee data to identify factors that contribute to high employee turnover. Predictive analytics help analyze an employee’s performance, learning, moods, and preferences to improve performance, meet professional needs, and plan career development. Such an analysis will help companies reduce staffing costs, satisfy their employees, and manage their resources.
Managing inventory and required supplies becomes much easier with predictive analytics. It helps companies assess the cost and profitability of their products in the long term. In this case, predictive analytics uses historical data and statistical models to predict future supply chain performance, demand, and potential disruptions. This will help companies identify and eliminate risks in advance, optimize processes and resources, and make successful and effective decisions.
Prescriptive analytics
Prescriptive analytics considers all possible factors, scenarios, and predictions and suggests conclusions based on them. It answers the question “What should we do next?”
Such combinations provide the ability to see what decisions and how can affect the future, based on all possible scenarios and potential outcomes. This will allow the business to decide on a strategy, “route” and further action plan. That is why prescriptive analytics plays a big role in business and is so in demand.
Amazinum Portfolio in Data Analysis
How it comes to life with Amazinum team:
Companies that already use Data Analysis
Microsoft
Data analysis is used by Microsoft for business intelligence, customer support, and product development. One well-liked tool for data visualization and analysis is Microsoft’s Power BI.
Tesla
Tesla uses data analysis to develop autonomous driving, enhance vehicle performance, and perform predictive maintenance. The business gathers and examines data from its automobile fleet.
Twitter uses data analysis to optimize content, increase user engagement, and measure the effectiveness of advertising. To improve its services, the platform examines user interactions and tweets.
Walmart
Walmart employs data analysis for customer insights, supply chain optimization, and inventory management. The business uses data to increase the effectiveness of its operations.
NASA
NASA uses data analysis for satellite missions, climate research, and space exploration. Interpreting the enormous amounts of data gathered from space missions requires data analysis.
PayPal
PayPal uses data analysis to track transactions, identify fraud, and examine consumer behavior. The business uses data to make sure that financial transactions are safe and easy.
General Electric (GE)
GE uses data analysis for energy management, manufacturing process optimization, and predictive maintenance of industrial equipment. Data is used by the business to improve the performance of its wide range of products.
Adobe
Adobe tracks user engagement, optimizes products, and uses data analysis for marketing analytics. Businesses frequently use Adobe Analytics to examine consumer behavior and the efficacy of digital marketing.
Coca-Cola
Coca-Cola uses data analysis to forecast demand, optimize its supply chain, and improve the efficacy of its marketing campaigns. To inform its product strategies, the company examines market trends and consumer preferences.
Fitbit
Fitbit is a company in the fitness tracking sector that tracks activity and health and uses data analysis to provide user behavior insights, personalized recommendations, and health information. Data is used to create customized exercise regimens.
HubSpot
HubSpot uses data analysis to score leads, automate marketing campaigns, and manage customer relationships. The platform aids companies in the analysis and improvement of their marketing initiatives.
Ford
Ford uses data analysis for predictive maintenance, vehicle diagnostics, and performance enhancement. Data is being used by the automotive industry more and more to increase vehicle efficiency and safety.
Our Industry Focus
Our industry knowledge and background give our clients and partners confidence that we understand their business. Here we highlighted a few top industries we are good at, penetrating to the smallest details and nuances of a certain branch.

SEO & Marketing
Healthcare

Safety & Security

Sport
E-commerce & Retail

Gambling and Casino
Manufacture

Ecology

FinTech

Energy

Localisation

IoT
Vitaliy Fedorovych
CEO, Data Scientist at Amazinum

Hello there!
Amazinum Team assists you through all data science development processes:
from data collection to valuable insights generation.
Get in touch with our CEO and Data Scientist to figure out the next move together
- 4A Peremohy square, Ternopil, Ukraine, 46000
- +380 98 85 86 330
- vfedorovych@amazinum.com
Contact Us
Contact Us

Bazarnitska Alina
Client Partner

Ihor Khreptyk
Client Partner

Stopnyk Zoriana
Client Partner

Vitaliy Fedorovych
CEO, Data Scientist